Projects
Project 1
Olist Store E-Commerce
Excel Dashboard
Goal
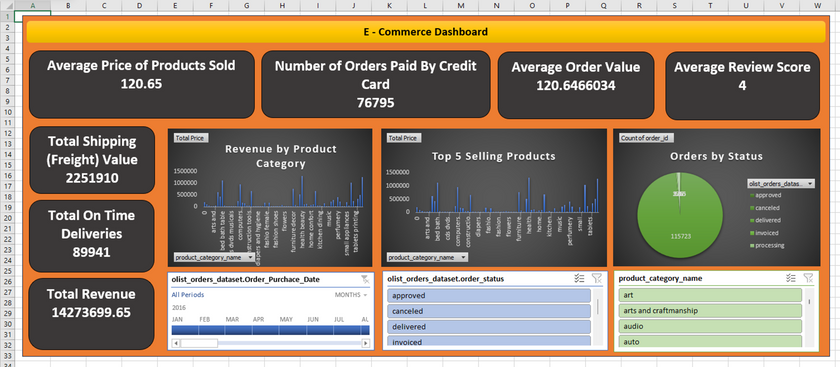
I developed this dynamic Excel dashboard to transform 115,000+ rows of raw transactional data into a centralized command center. The objective was to provide stakeholders with real-time visibility into the $14.27M revenue stream, allowing them to monitor high-level KPIs like Average Order Value and On-Time Delivery rates through a single, interactive interface.
Process
-
Data Cleaning: Used Power Query to fix date formats, handle missing review scores and group 70+ messy product categories into clean labels
-
Data Modeling: Linked three separate tables (Orders, Payments and Products) using Order_ID as the primary key
-
KPI Engineering:
-
On-Time Delivery: Created logic to compare "Estimated" vs. "Actual" delivery dates
-
Average Order Value (AOV): Calculated total revenue divided by unique order counts
-
Key Insights
-
Single-Item Problem: The Average Product Price ($120.65) and Average Order Value ($120.64) are nearly identical. Customers almost never buy more than one item at a time.
-
Shipping Drain: Freight costs ($2.25M) eat up 15.8% of total revenue. This is a major leak in profit margins.
-
Revenue Concentration: A tiny fraction of categories (Health/Beauty, Housewares) generates the majority of the $14.2M revenue.
Recommendations
-
Bundle Products: Launch a "Free Shipping over $150" rule to push the $120 AOV higher and encourage multi-item carts.
-
Cut the Long Tail: Stop marketing the bottom 50% of low-performing categories and reinvest that budget into the top 5 "Hero" categories.
-
Logistics Check: With 16% of revenue going to shipping, the company should move inventory closer to high-density customer hubs to lower freight costs.